Sizing the storage facility
Design hyetograph
The hyetograph distributes over time the rainfall depth given by the curve.
| Type | When to use it |
|---|---|
| Chicago | The most common: peak position set with the coefficient r |
| Uniform | Constant intensity for the whole duration |
| Sifalda | Three segments, trapezoidal shape |
| Triangular | Linear rise and fall |
For the Chicago hyetograph the position coefficient r indicates where the peak falls: 0.4 means at 40 % of the duration.
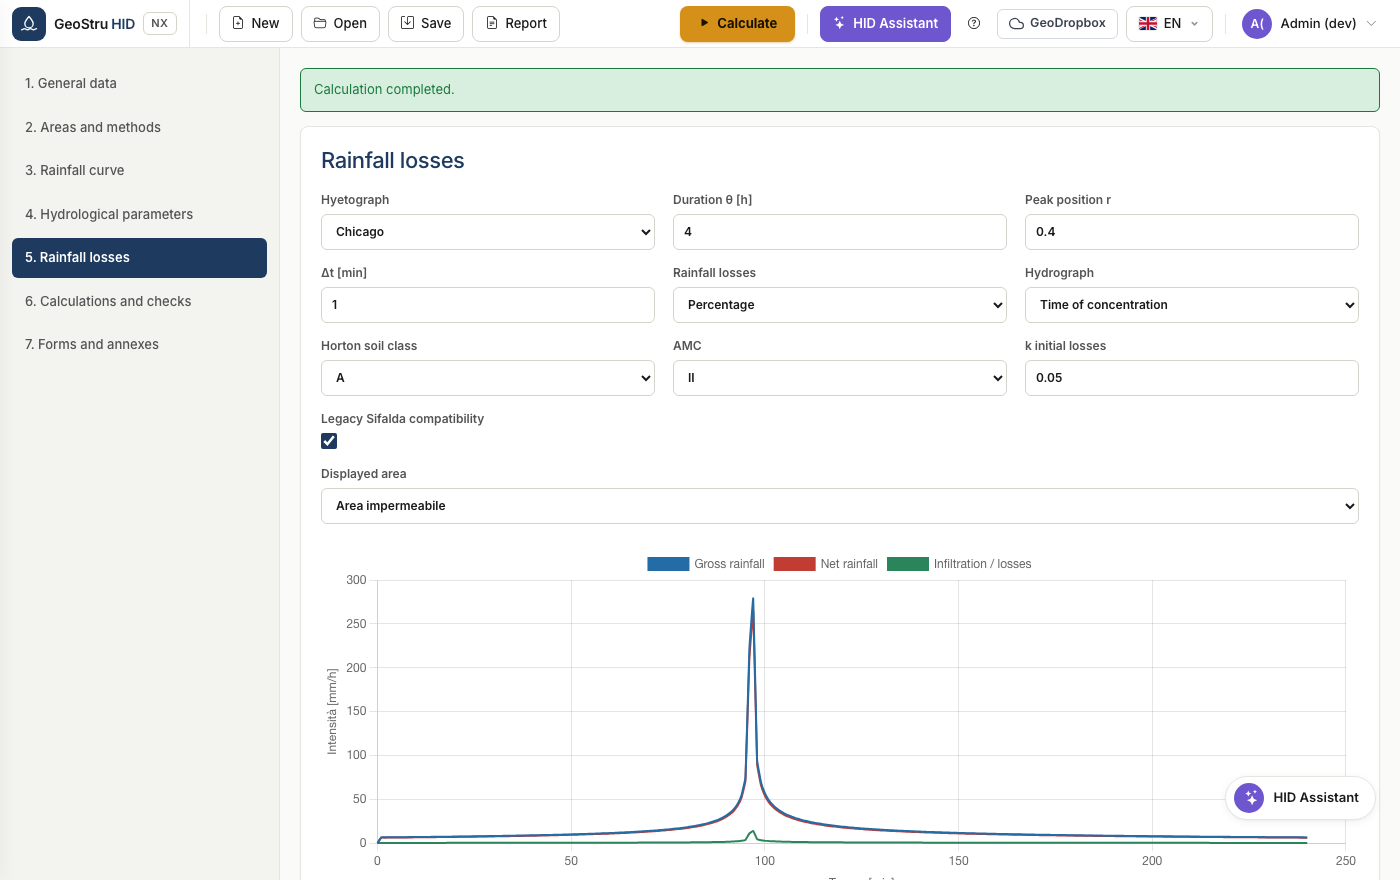
Rainfall losses
They turn gross rainfall into net rainfall, that is the part that becomes runoff.
- Percentage — multiplies by the runoff coefficient φ of the surface. It is the simplest and most widely used model.
- Horton — infiltration decreasing over time according to the soil class.
- SCS-CN — the curve number method, with antecedent moisture condition AMC I, II or III.
Lombardia
The SCS-CN method is not allowed by the regional regulation.
Hydrograph
It turns net rainfall into flow:
- Time-of-concentration method — uses the time of concentration of the surface.
- Nash — a cascade of n linear reservoirs with constant K, for more complex catchments.
Attenuation
The storage facility is routed step by step by solving the mass balance between inflow, outflow through the discharge device and accumulated volume. The maximum volume is the result of the detailed procedure.
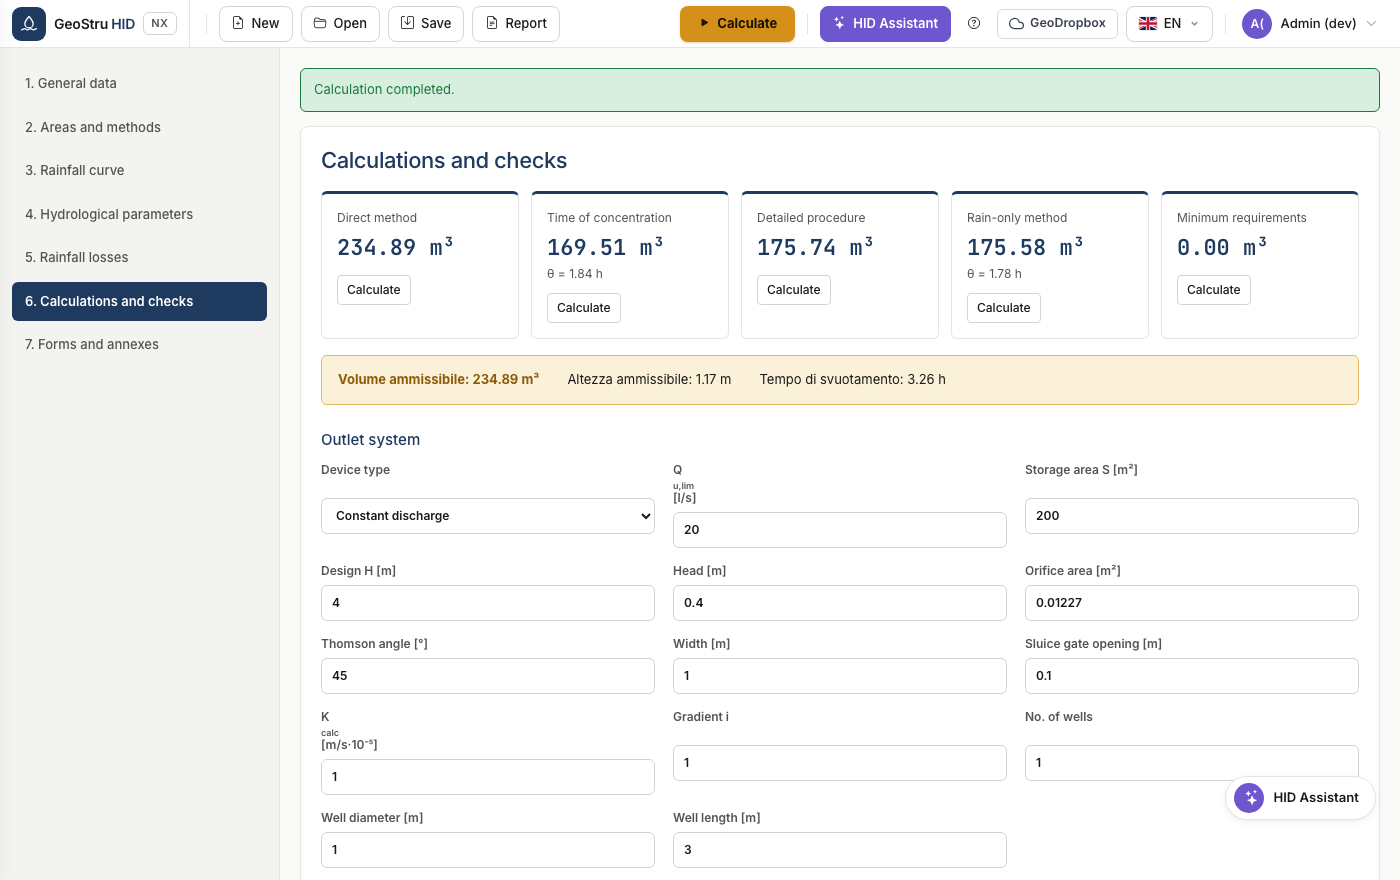
The final checks
| Check | Condition |
|---|---|
| Effective depth | Design H ≥ required depth |
| Effective volume | Design V ≥ allowable volume |
| Emptying time | T ≤ allowed time (normally 48 h) |
The emptying time is calculated only for constant-flow discharges and for constant infiltration: for the other devices the flow depends on the head and varies during emptying.
Found an error on this page? Let us know.