Quick start
Five minutes from opening the app to a verified storage volume. We will use the preloaded example from the manual, so the numbers you see are comparable.
1. Open the app and load the example
Go to nx.geostru.ai/hid. At startup you already have example 9.4 — Detailed procedure loaded: three surfaces for a total of 10,000 m².

All commands are in the top bar: New, Open, Save, Report, and on the right the Calculate button.
2. Check the surfaces
Open section 2. Areas and methods. Each row is a surface with its area and its runoff coefficient φ.
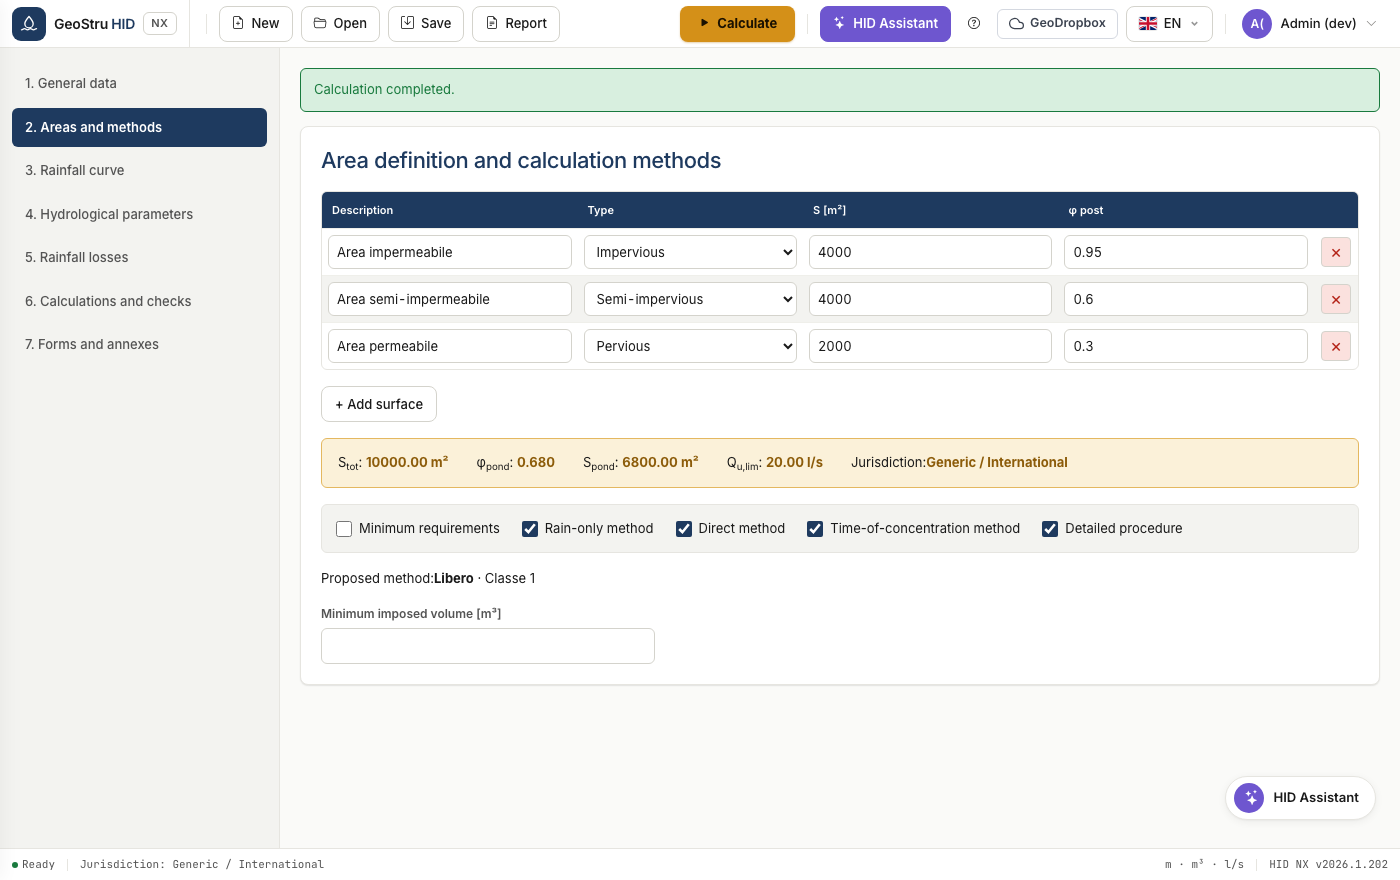
The coloured band shows the aggregate values: total area, weighted φ, weighted (impervious-equivalent) area and discharge limit. Below it you choose the methods to compare.
Tip
Keep several methods active. HID calculates them all and adopts the highest: it is the most conservative condition and it saves you from redoing the work if the reviewing authority asks for a different method.
3. Check the rainfall curve
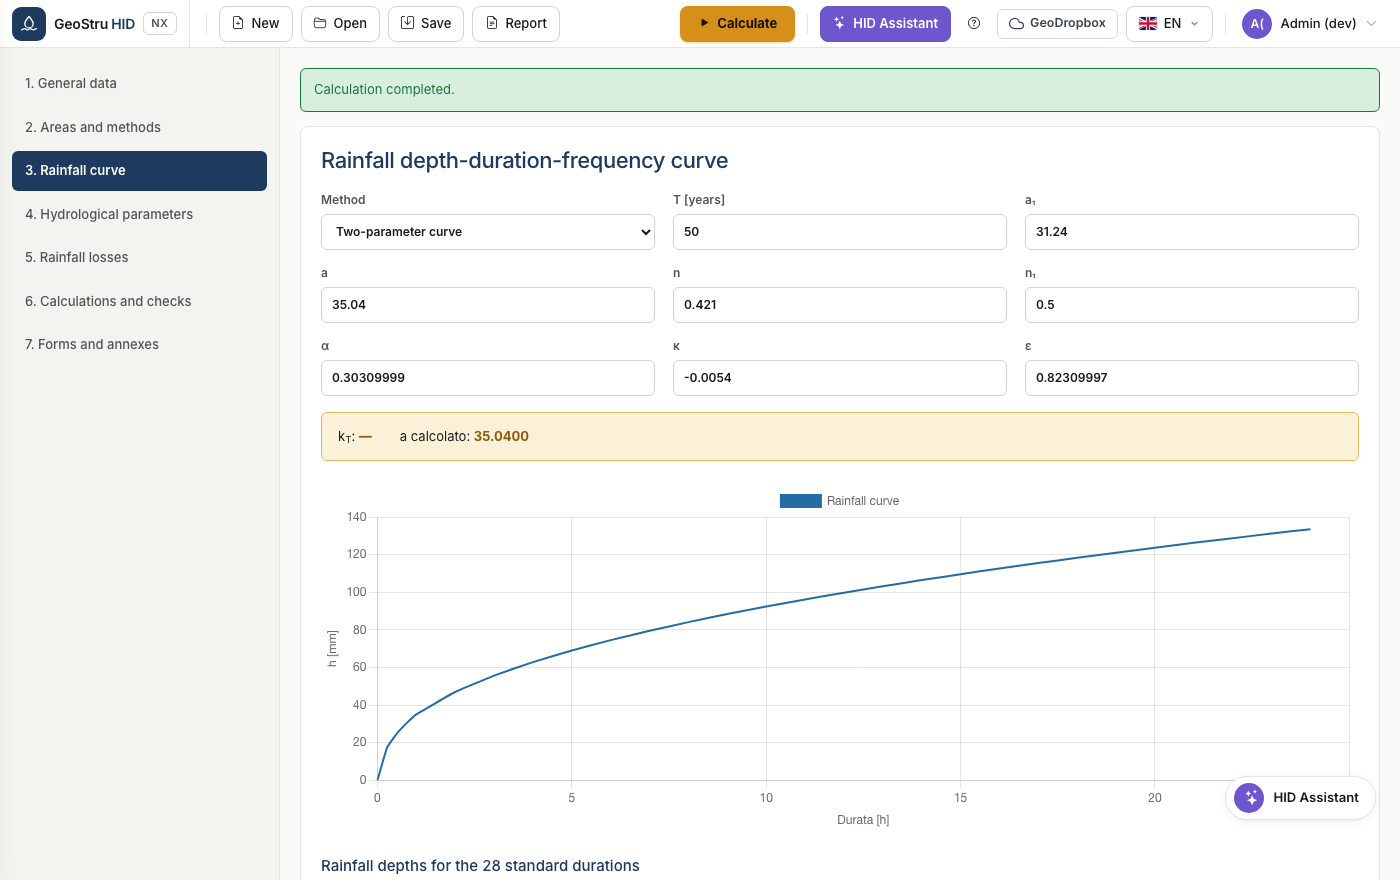
Section 3. Rainfall curve. With the two-parameter curve you enter a and
n; with the GEV you enter the distribution parameters and the return period.
4. Calculate
Press Calculate at the top right. Go to section 6. Calculations and checks.
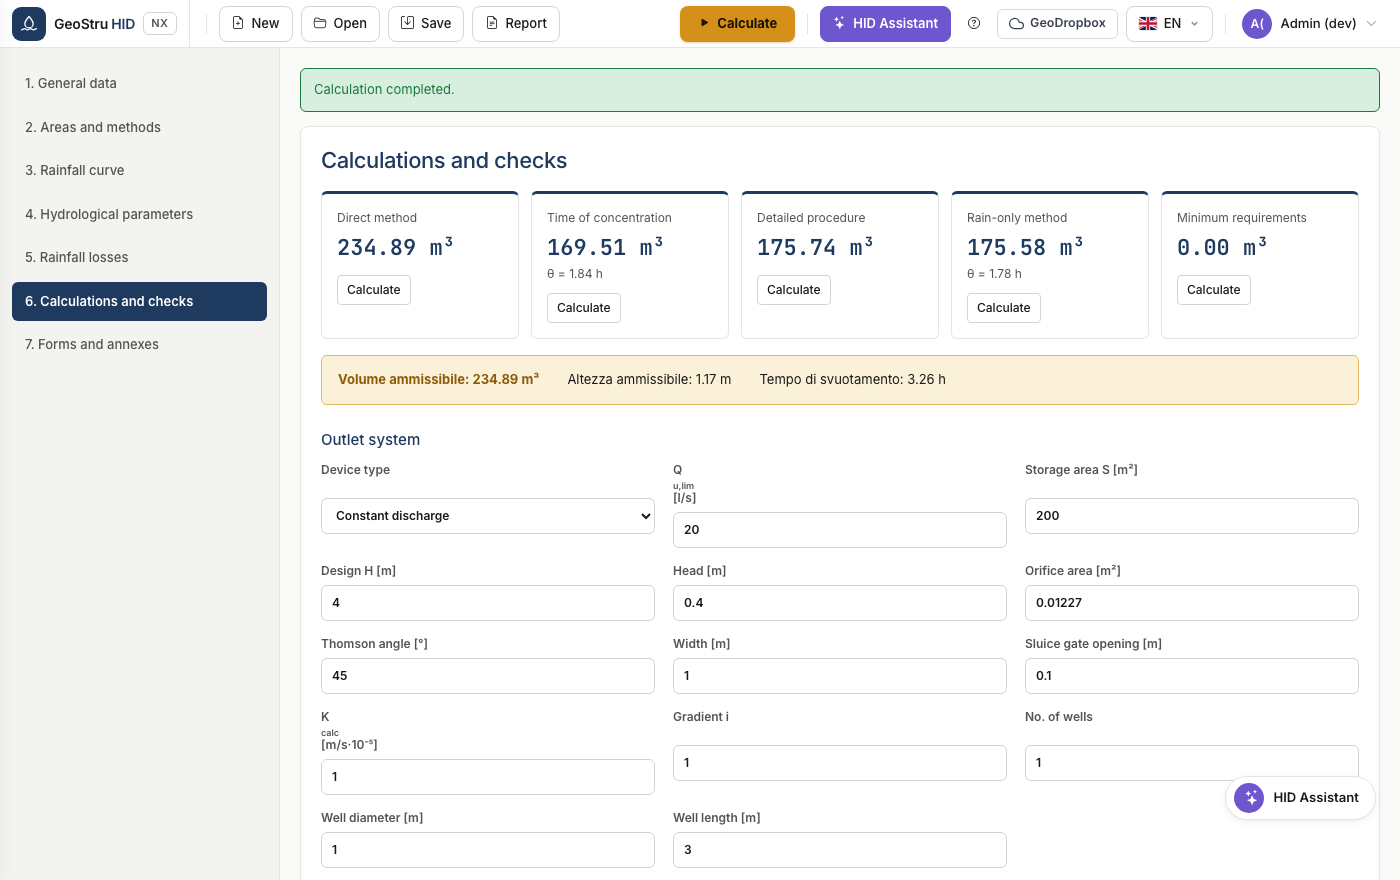
Each method has its own card with the calculated volume. The band below shows the adopted allowable volume, the corresponding depth and the emptying time.
For example 9.4 you should read: direct method 234.89 m³, time-of-concentration method 169.51 m³, detailed procedure 175.74 m³, rain-only method 175.58 m³. The adopted volume is 234.89 m³.
5. Produce the report
Open the Report menu in the bar and choose the format: Word, PDF or Word 97. The document comes out in the language selected in the app.
Found an error on this page? Let us know.